GKE Natively Supports Prometheus Metrics for Autoscaling
Google Cloud announced native support for Prometheus metrics in Google Kubernetes Engine (GKE), following an earlier rollout of GKE custom metrics. The new capability lets Horizontal Pod Autoscaler (HPA) process autoscaling metrics directly from Cloud Monitoring using Google Managed Service for Prometheus, with no third-party adapters required. The feature is in preview; the team plans to support self-hosted Prometheus servers by general availability.
Production workloads often need to scale on complex infrastructure metrics, such as the number of unacknowledged Pub/Sub messages, QPS stored in Cloud Monitoring or Prometheus, or the 95th percentile of request latency. Previously, this required deploying external adapters like the Stackdriver Custom Metrics Adapter or Prometheus adapter. Those adapters added operational friction: platform teams had to install and maintain them, intermediate adapter pods created extra failure points in the autoscaling loop, and cross-component communication required mapping Kubernetes service accounts to Cloud service accounts with specific IAM permissions.
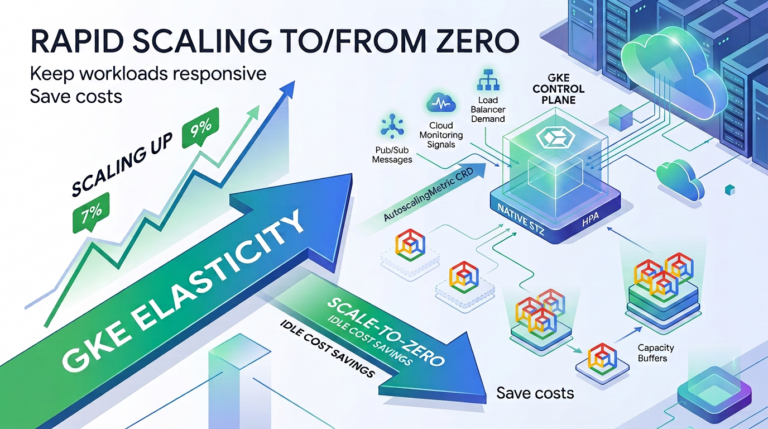
GKE extends the existing AutoscalingMetric object so that PromQL queries can read metrics directly from monitoring backends and feed them to HPA through a low-latency autoscaling pipeline. The controller runs on the GKE control plane and monitors the AutoscalingMetric custom resources. It only deploys the system pod on user nodes when a PromQL metric is actively requested; if no Prometheus metrics are configured, the controller shuts down to avoid resource overhead.
Configuration uses a standard AutoscalingMetric manifest. For example, a Pub/Sub queue depth can be exposed as a global scale metric, and the metric can then be referenced in a standard HorizontalPodAutoscaler in the format autoscaling.gke.io||. For per-pod scaling, the PromQL metric must include a label for the pod name and set type: Pods; this enables scaling across time windows and calculating rates or histogram percentiles, such as average memory usage over a five-minute rolling window.
Key benefits stated in the announcement are: no adapter maintenance, streamlined security because the Kubernetes Default Node Service Agent already has read access to Cloud Monitoring and Google Managed Prometheus in the same project, low latency thanks to backend polling every 15 seconds, rich PromQL query support, and compatibility with the new HPA scale-to-zero capability for scaling to zero replicas and recovering quickly via CapacityBuffers API.