Profiling PyTorch: Reading torch.profiler Traces from Scratch
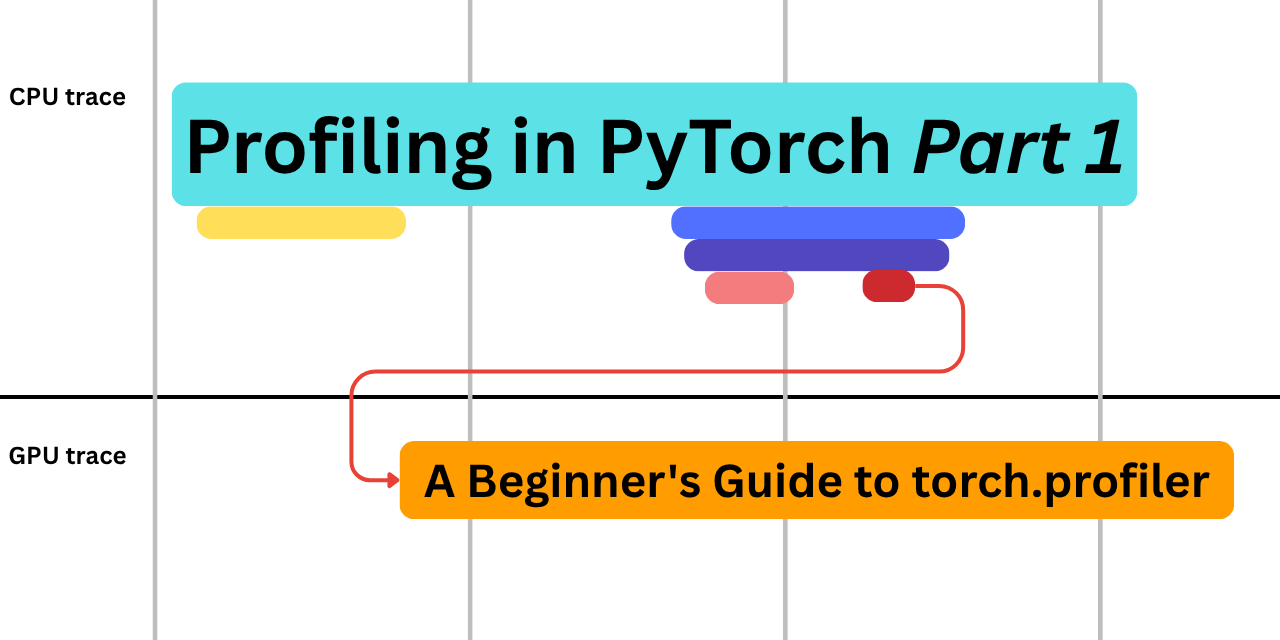
Profiling in PyTorch has a steep on-ramp because traces are dense and intimidating, yet you cannot optimize what you cannot profile.
This article exposes the tension between knowing you should profile and actually being able to read the output, using a simple matrix multiplication + bias add as a controlled case study.
The authors adopt a question-led format — open a trace, ask why something looks odd, chase the answer — to turn profiler artifacts from noise into a diagnostic tool.